Abstract
In random sampling, each member of a population has an equal chance or probability of being selected. This process provides an unbiased representation of the total population where each observation is selected independently.
Definition
Given a population of \(N\) observations, random sampling selects \(n\) observations where each has equal probability:
\[
P(\text{selection}) = \frac{1}{N}
\]
The sample mean \(\bar{x}\) estimates the population mean \(\mu\):
\[
\bar{x} = \frac{1}{n} \sum_{i=1}^{n} x_i
\]
Why Random Sampling?
- Reduces bias: Every data point has equal chance of selection
- Computational efficiency: Analyze subset instead of full dataset
- Statistical validity: Sample statistics approximate population parameters
- Backtesting: Test strategies on random subsets to avoid overfitting
Example (Python)
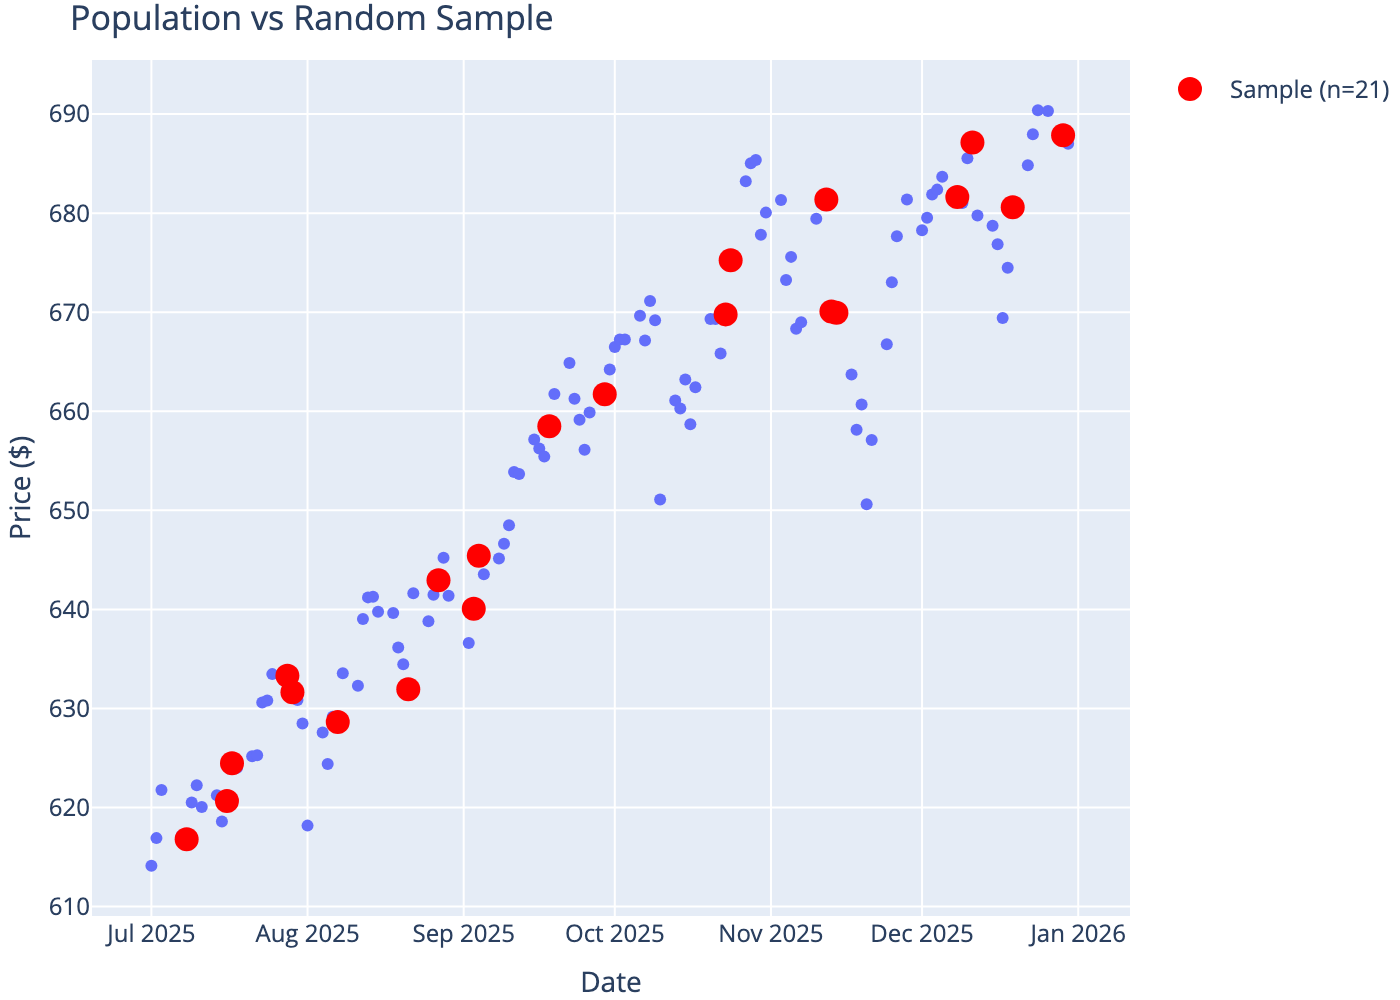
We randomly sample 21 trading days from 6 months of SPY price data.
Population: 127 trading days
Sample: 21 randomly selected days
| 0 |
2025-07-08 |
616.80 |
| 1 |
2025-07-16 |
620.66 |
| 2 |
2025-07-17 |
624.46 |
| 3 |
2025-07-28 |
633.31 |
| 4 |
2025-07-29 |
631.64 |
| 5 |
2025-08-07 |
628.64 |
| 6 |
2025-08-21 |
631.93 |
| 7 |
2025-08-27 |
642.94 |
| 8 |
2025-09-03 |
640.07 |
| 9 |
2025-09-04 |
645.42 |
| 10 |
2025-09-18 |
658.48 |
| 11 |
2025-09-29 |
661.72 |
| 12 |
2025-10-23 |
669.78 |
| 13 |
2025-10-24 |
675.25 |
| 14 |
2025-11-12 |
681.37 |
| 15 |
2025-11-13 |
670.06 |
| 16 |
2025-11-14 |
669.95 |
| 17 |
2025-12-08 |
681.62 |
| 18 |
2025-12-11 |
687.14 |
| 19 |
2025-12-19 |
680.59 |
| 20 |
2025-12-29 |
687.85 |
Sample vs Population
| 0 |
Mean Price |
655.67 |
654.27 |
| 1 |
Std Dev |
21.95 |
24.05 |
| 2 |
Min |
614.13 |
616.80 |
| 3 |
Max |
690.38 |
687.85 |
Conclusion
Random sampling enables unbiased analysis of large datasets using smaller representative subsets. The sample statistics approximate the population parameters, making it a fundamental technique in quantitative finance for backtesting and model validation.