| Ticker | Ann. Return (%) | Ann. Volatility (%) | Sharpe Ratio | |
|---|---|---|---|---|
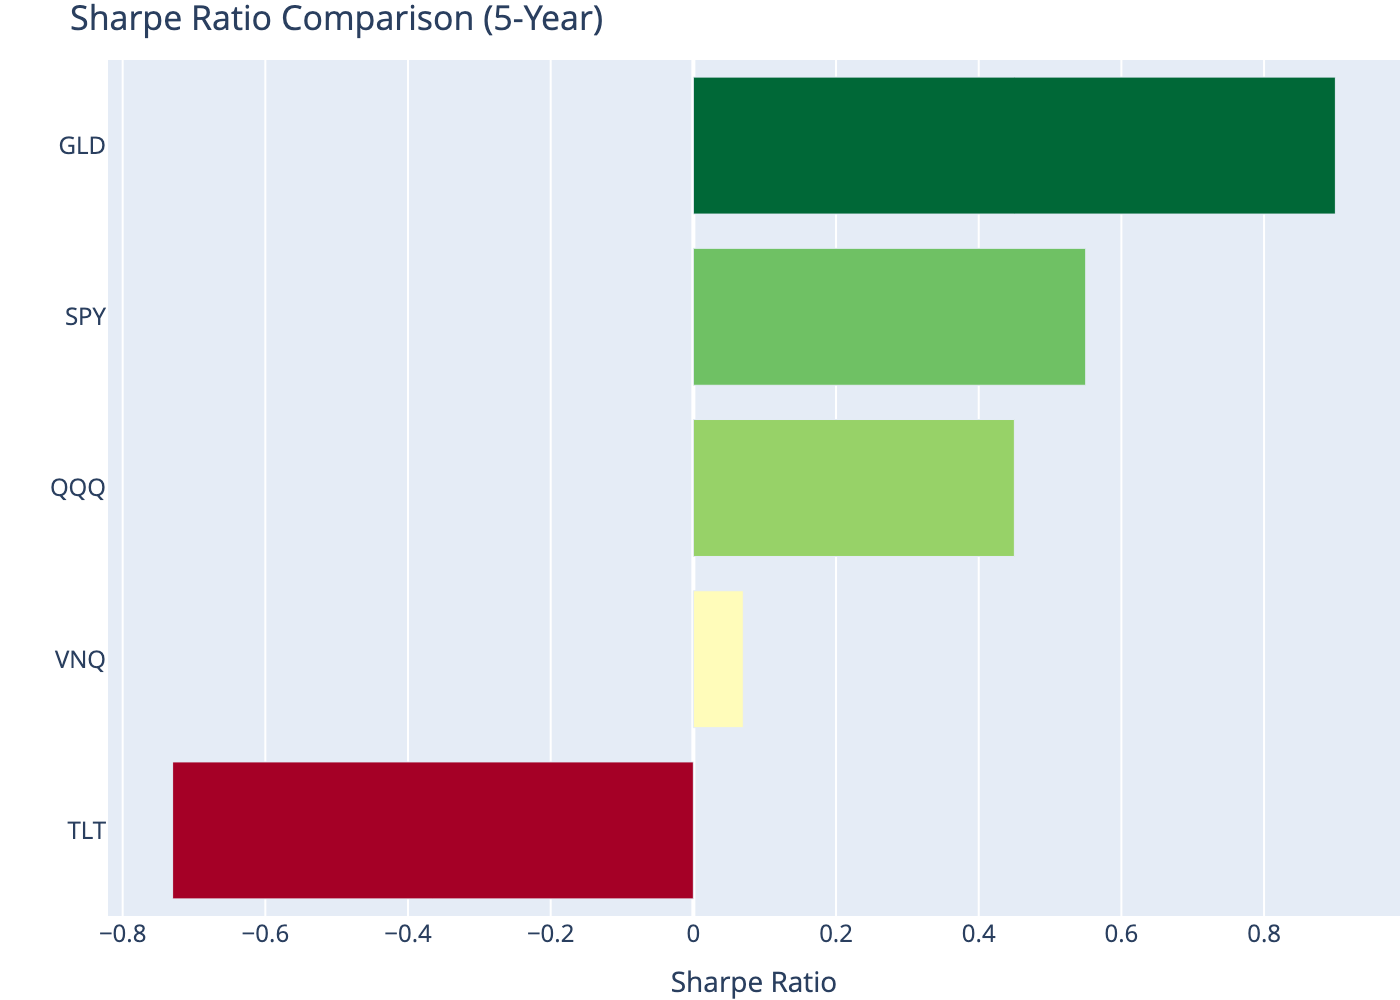
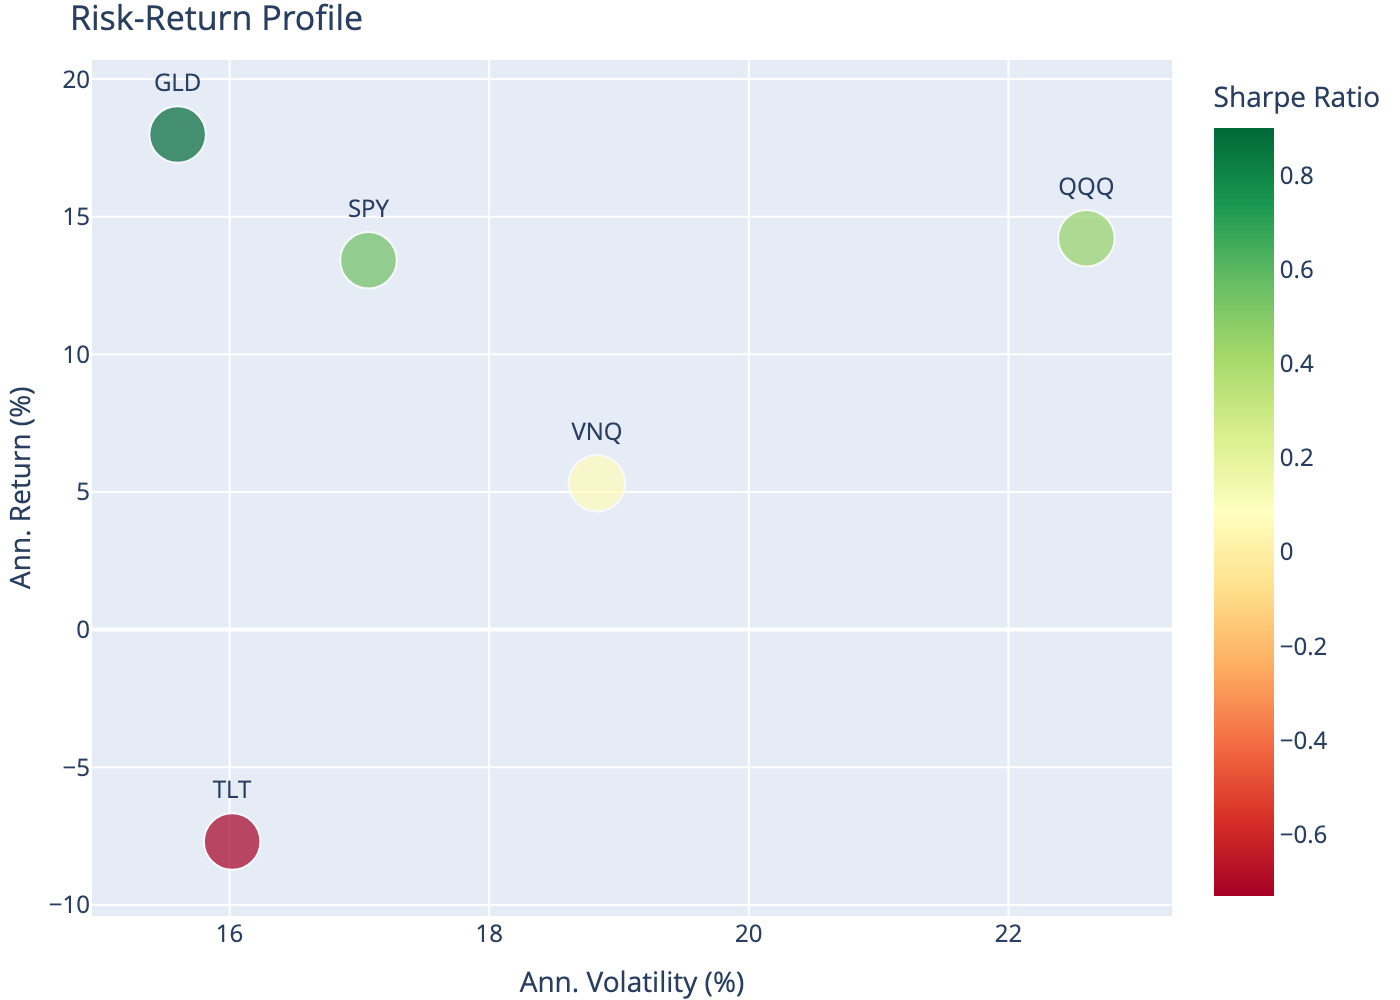
| 0 | SPY | 13.42 | 17.07 | 0.55 |
| 1 | QQQ | 14.22 | 22.60 | 0.45 |
| 2 | TLT | -7.70 | 16.02 | -0.73 |
| 3 | GLD | 17.99 | 15.60 | 0.90 |
| 4 | VNQ | 5.32 | 18.83 | 0.07 |
Sharpe Ratio
Risk-adjusted performance measurement
finance
basics
portfolio
The Sharpe ratio measures excess return per unit of risk, enabling comparison across investments with different risk profiles.
1 Abstract
The Sharpe ratio, developed by William Sharpe in 1966, measures the excess return per unit of risk. It remains the most widely used metric for risk-adjusted performance, allowing investors to compare investments with different volatility levels on a common scale (Sharpe, 1964).
2 Definition
The Sharpe ratio is defined as:
\[ SR = \frac{R_p - R_f}{\sigma_p} \]
Where:
- \(R_p\) = portfolio return
- \(R_f\) = risk-free rate
- \(\sigma_p\) = portfolio standard deviation (volatility)
The numerator \((R_p - R_f)\) is the excess return — the return above the risk-free rate. The denominator \(\sigma_p\) is the risk measured by volatility.
3 Interpretation
| Sharpe Ratio | Interpretation |
|---|---|
| < 0 | Negative excess return |
| 0 - 1 | Acceptable, risk may not be adequately compensated |
| 1 - 2 | Good risk-adjusted return |
| 2 - 3 | Very good |
| > 3 | Excellent (rare, verify data) |
4 Annualization
For daily returns, the annualized Sharpe ratio is:
\[ SR_{ann} = \sqrt{252} \cdot \frac{\bar{r}_d - r_f/252}{\sigma_d} \]
Where \(\bar{r}_d\) is the mean daily return and \(\sigma_d\) is the daily standard deviation.
5 Compute (Python)
We calculate the Sharpe ratio for several ETFs representing different asset classes.
6 Sharpe Ratio Comparison
7 Risk-Return Scatter
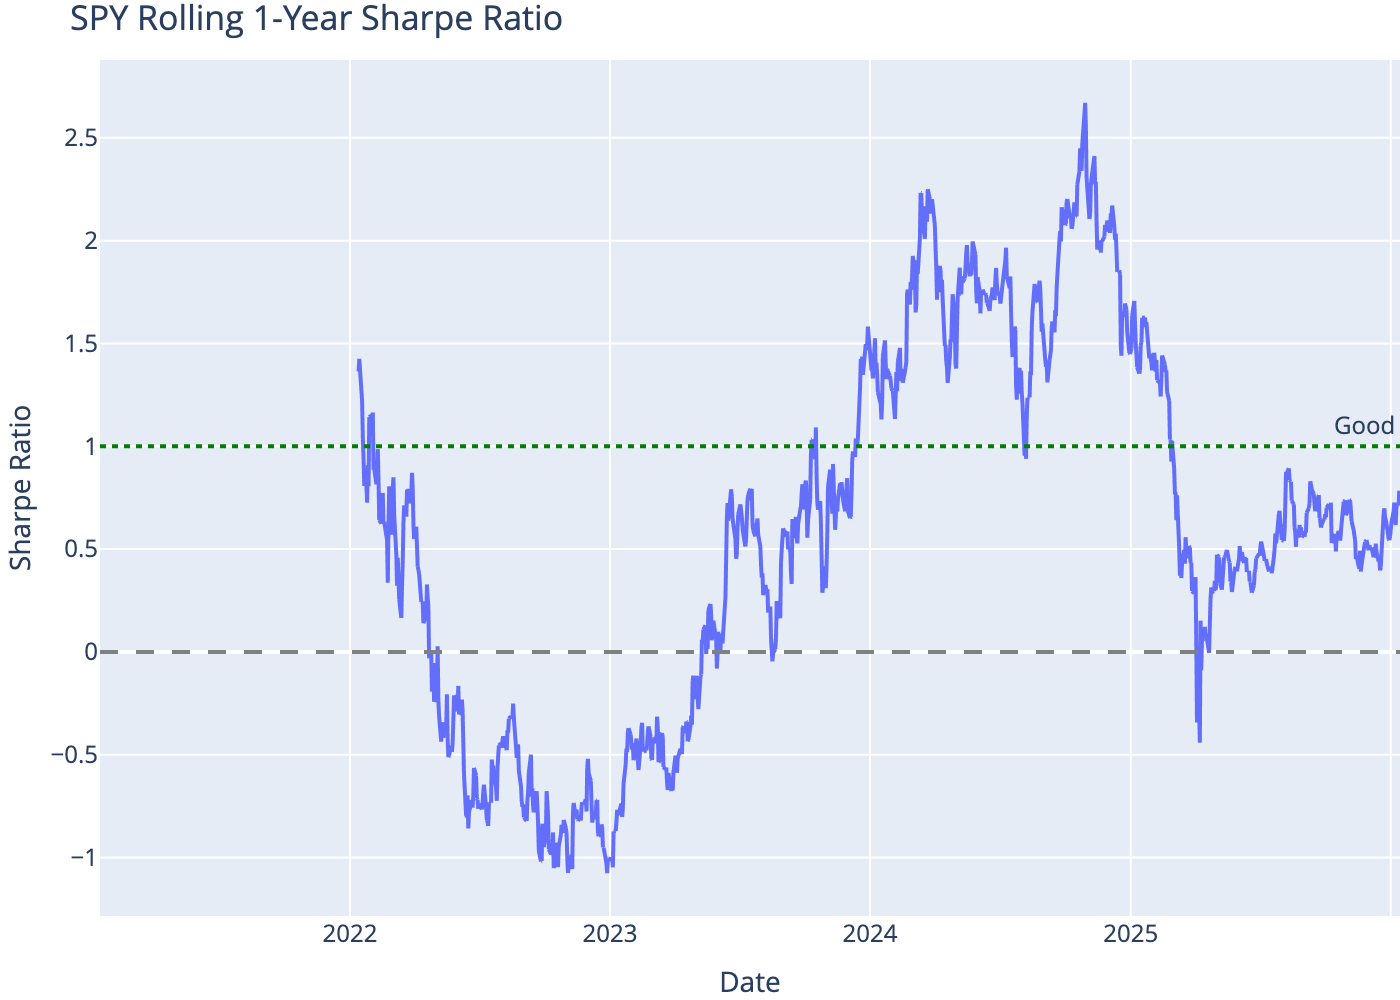
8 Rolling Sharpe Ratio
The Sharpe ratio varies over time. A rolling window shows how risk-adjusted performance evolves.
9 Limitations
- Assumes normal distribution: Penalizes upside volatility equally to downside
- Sensitive to time period: Different periods yield different results
- Risk-free rate choice: Results vary with the benchmark rate used
- Not suitable for: Strategies with non-normal returns (options, hedge funds)
For strategies with asymmetric returns, consider the Sortino ratio (uses downside deviation) or Calmar ratio (uses max drawdown).
10 Conclusion
The Sharpe ratio provides a standardized measure of risk-adjusted return, enabling comparison across assets with different volatility profiles. While widely used, it should be considered alongside other metrics, particularly for strategies with non-normal return distributions.
References
Sharpe, W. F. (1964). Capital asset prices: A theory of market equilibrium under conditions of risk. The Journal of Finance, 19(3), 425–442.